Research + Statistics

Research + Statistics
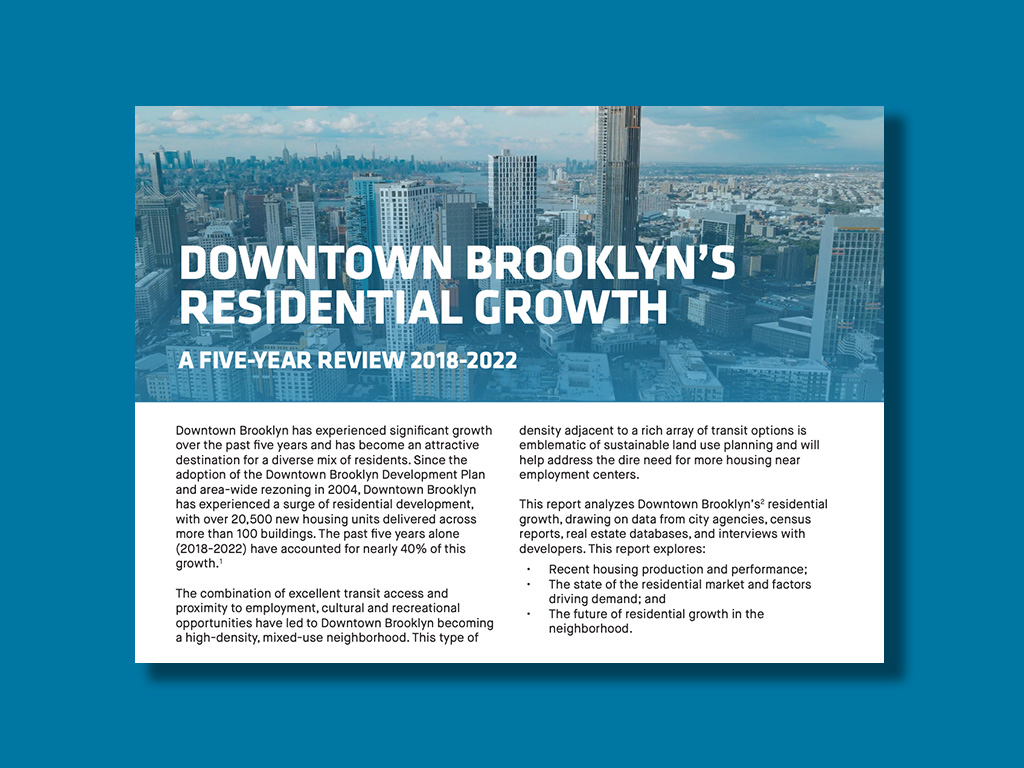
Downtown Brooklyn Statistics
Click any of the five category tabs below to access the relevant statistics for each. Click the arrow at the bottom of the slide to navigate to the next page.
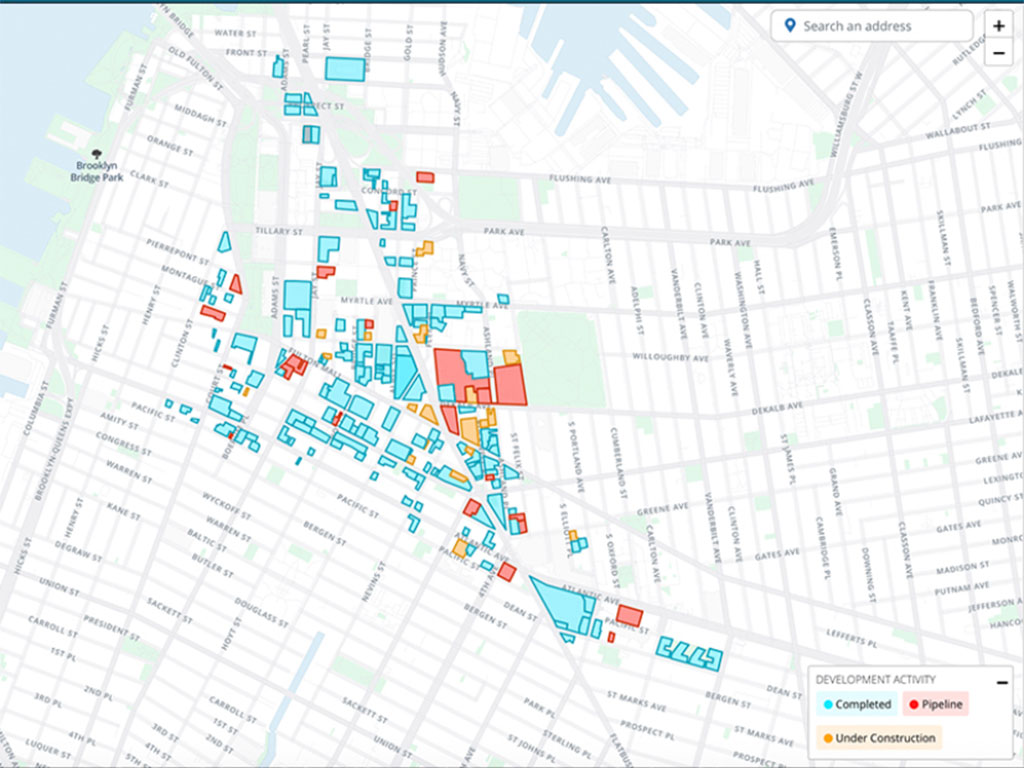
Downtown Brooklyn Development Dashboard
This interactive tool makes it easy to explore the neighborhood’s major development projects – from what’s planned and under construction to everything completed since the 2004 rezoning. Browse an interactive map with project details, photos, and links, or use filters to search by category and date. You can also dive into a data dashboard to view, filter, and download the full set of development information.
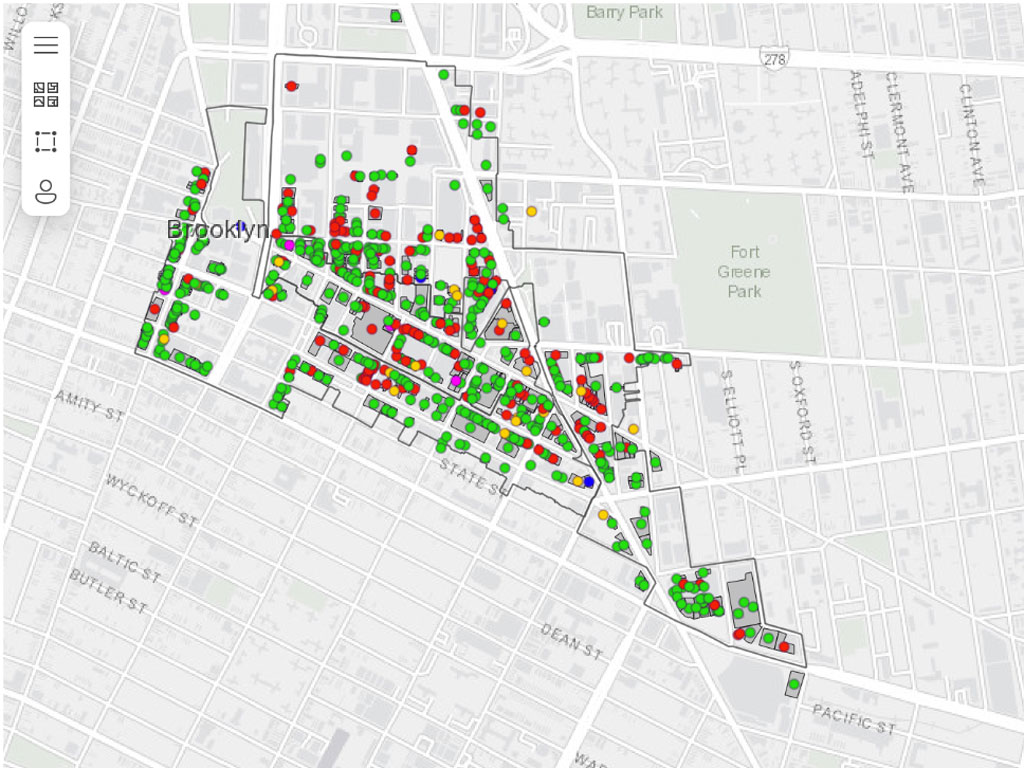
DOWNTOWN BROOKLYN RETAIL DASHBOARD
Explore Downtown Brooklyn’s retail spaces with our interactive Retail Dashboard. This dashboard tracks retail space in the neighborhood, including data such as square footage, operation status, rents, and more. Hover over any dot on the map to view details specific to each store. Use any of the filters above the map to filter by square footage, business type, floor, operating status, or search by business name.
DBP Reports
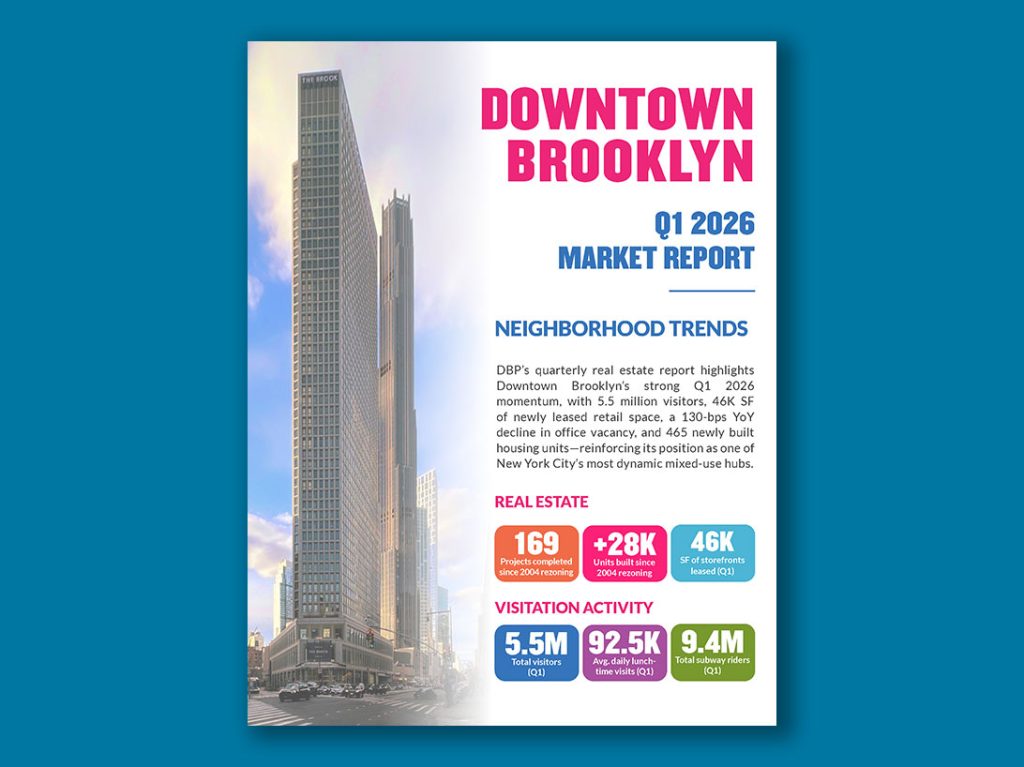
Downtown Brooklyn Q1 2026 Market Report
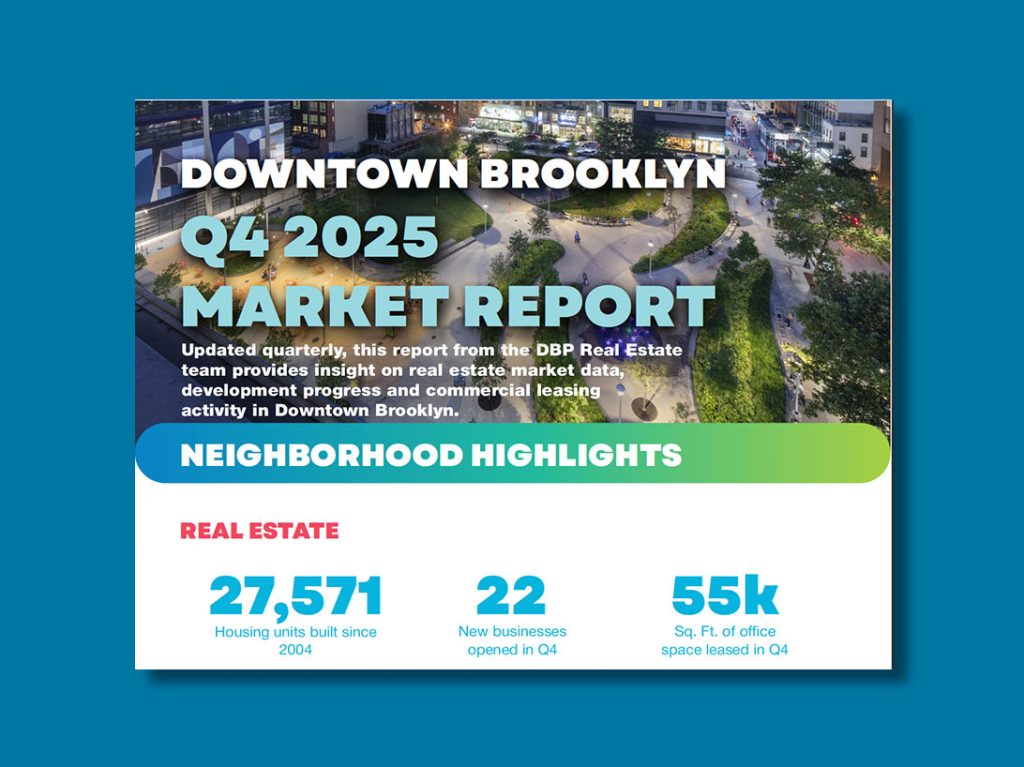
Downtown Brooklyn Q4 2025 Market Report
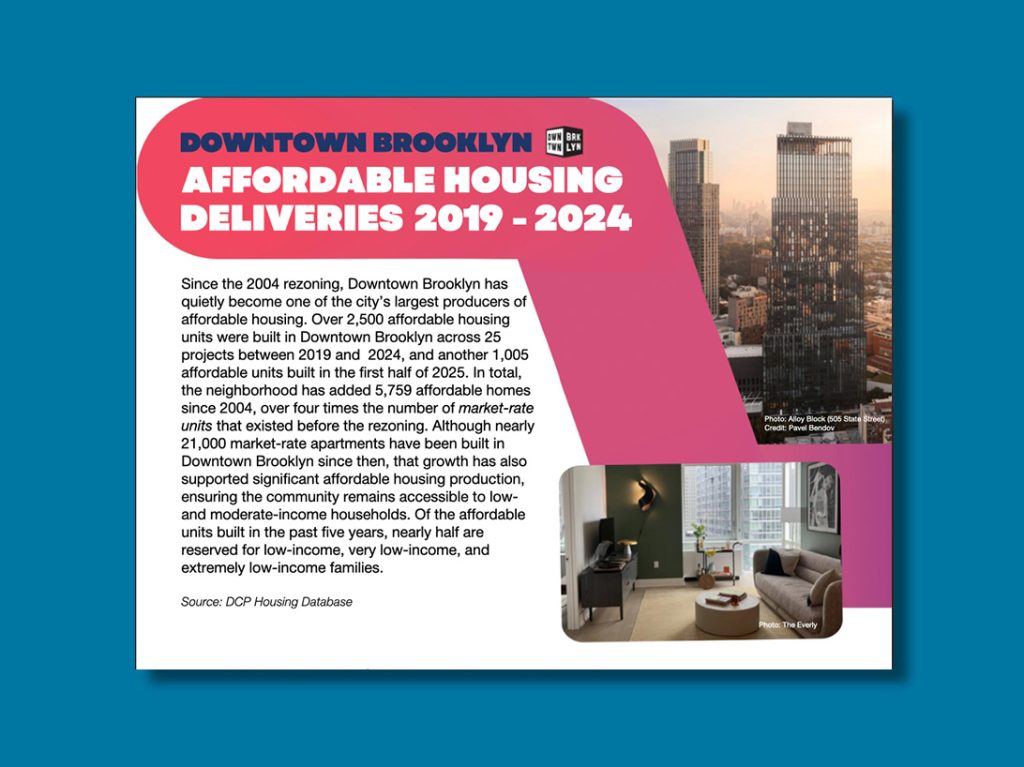
Downtown Brooklyn Affordable Housing Development 2019-2024
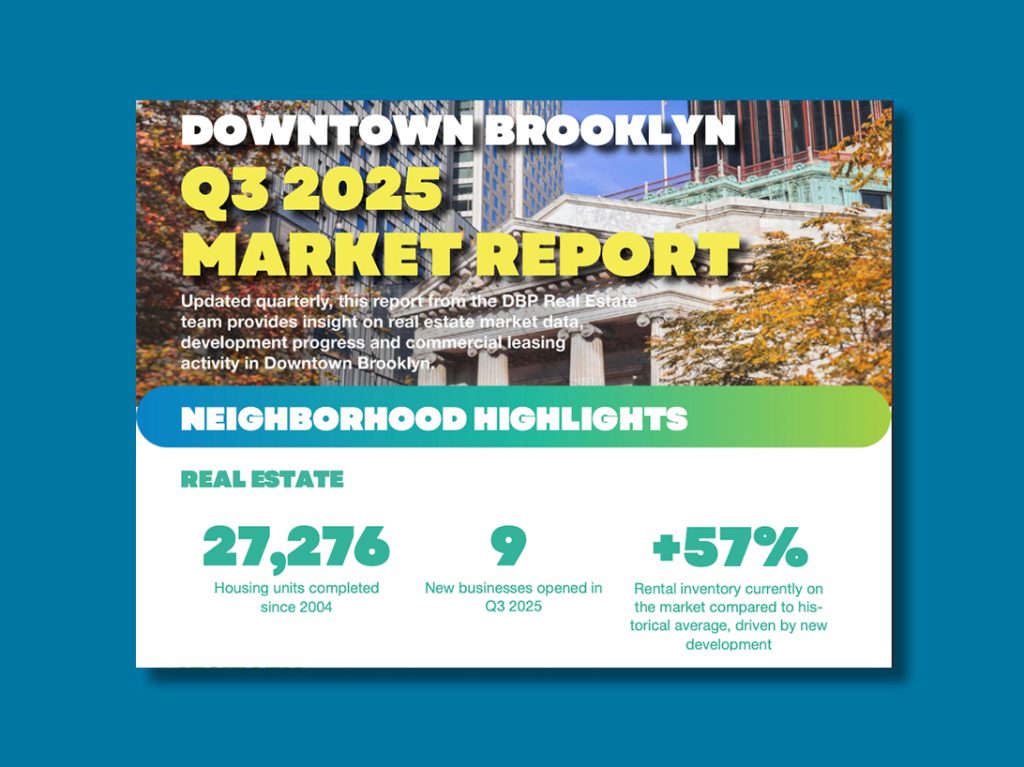
Downtown Brooklyn Q3 2025 Market Report
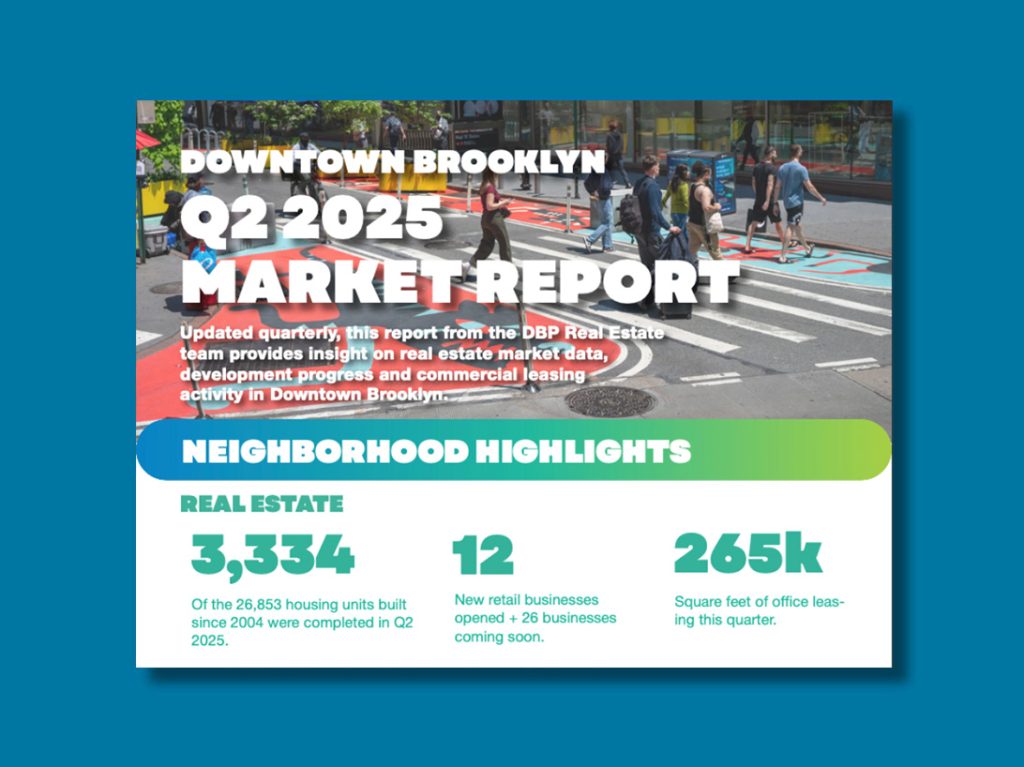
Downtown Brooklyn Q2 2025 Market Report
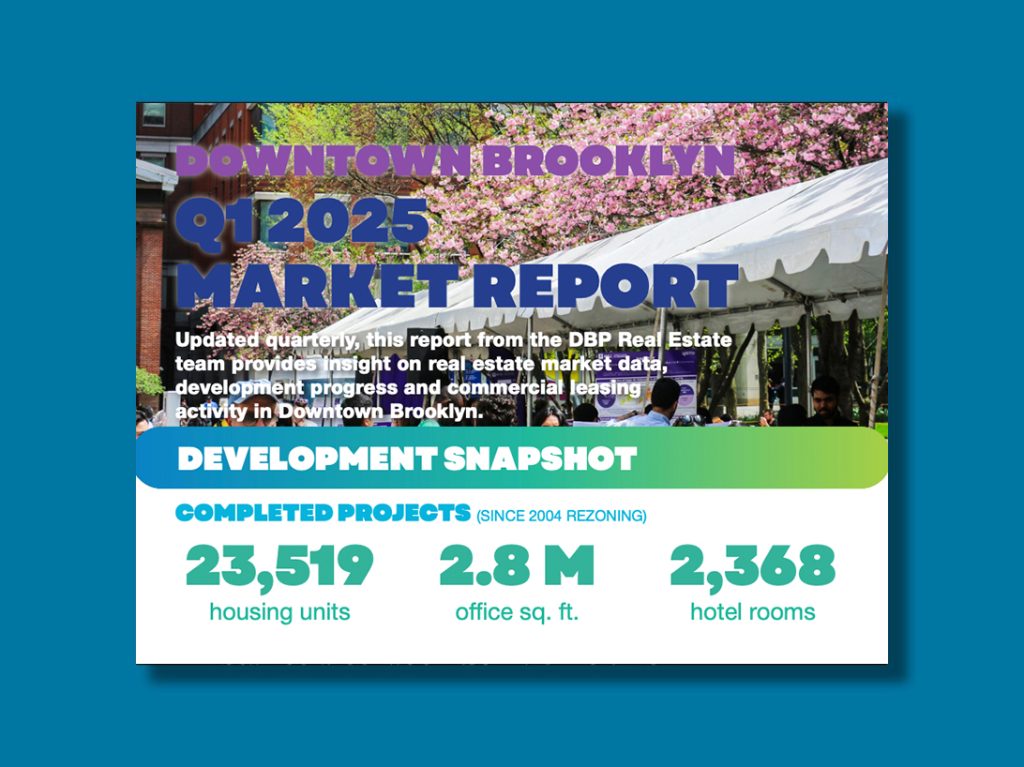
Downtown Brooklyn Q1 2025 Market Report
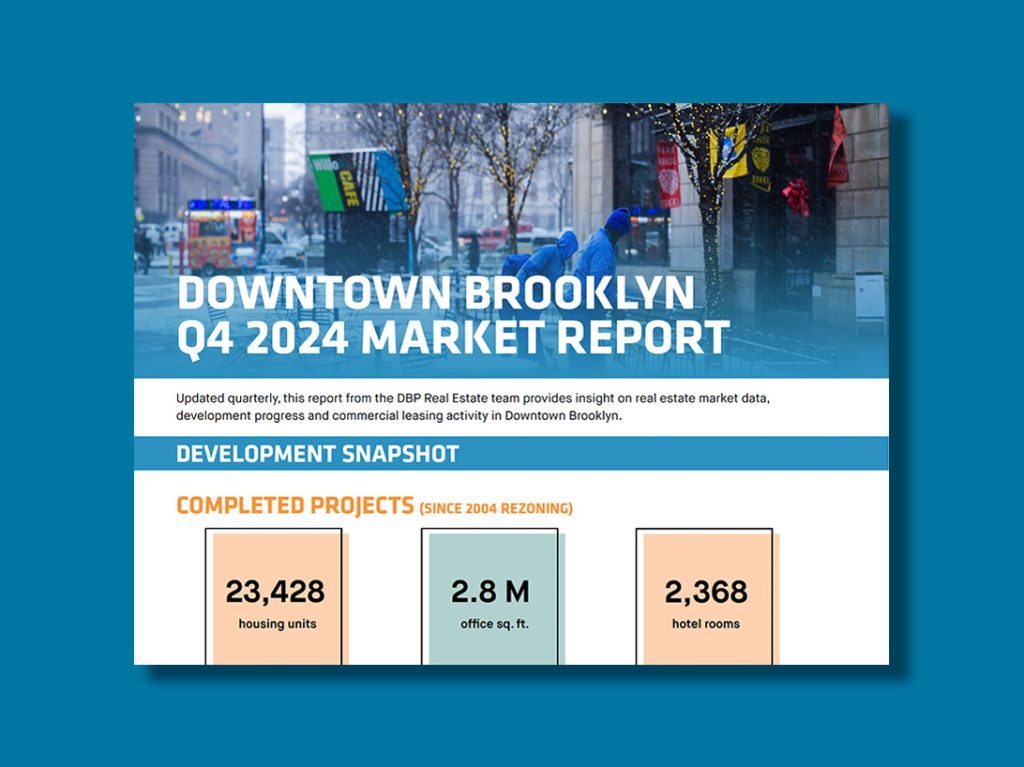
Downtown Brooklyn Q4 2024 Market Report
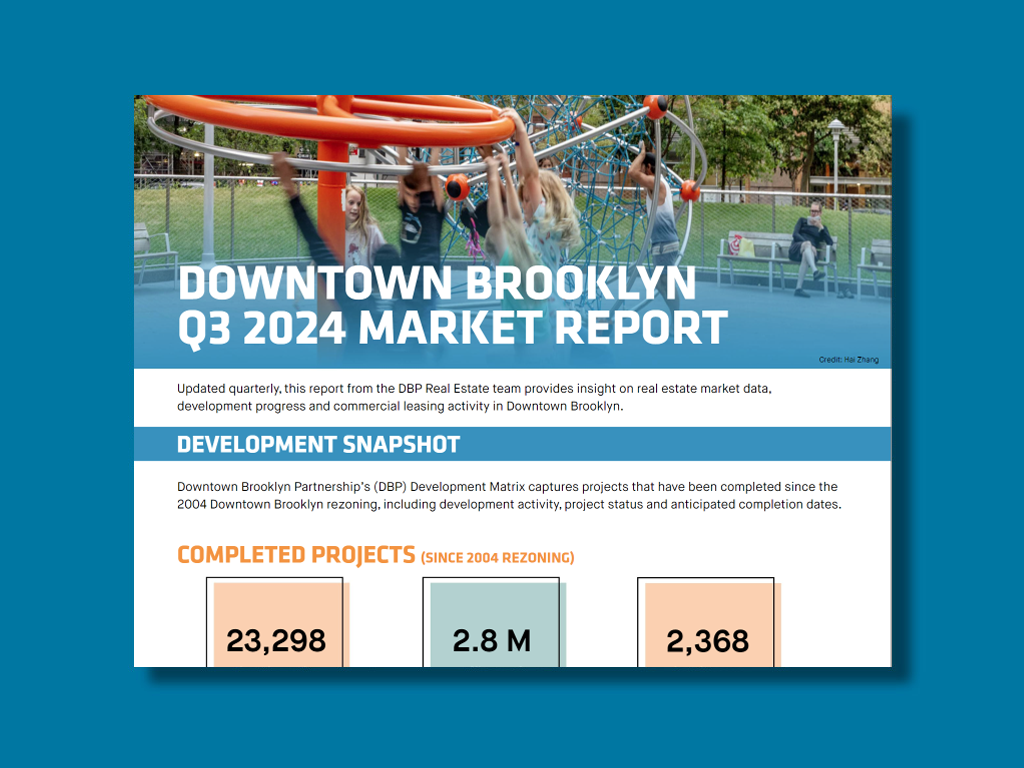
Downtown Brooklyn Q3 2024 Market Report
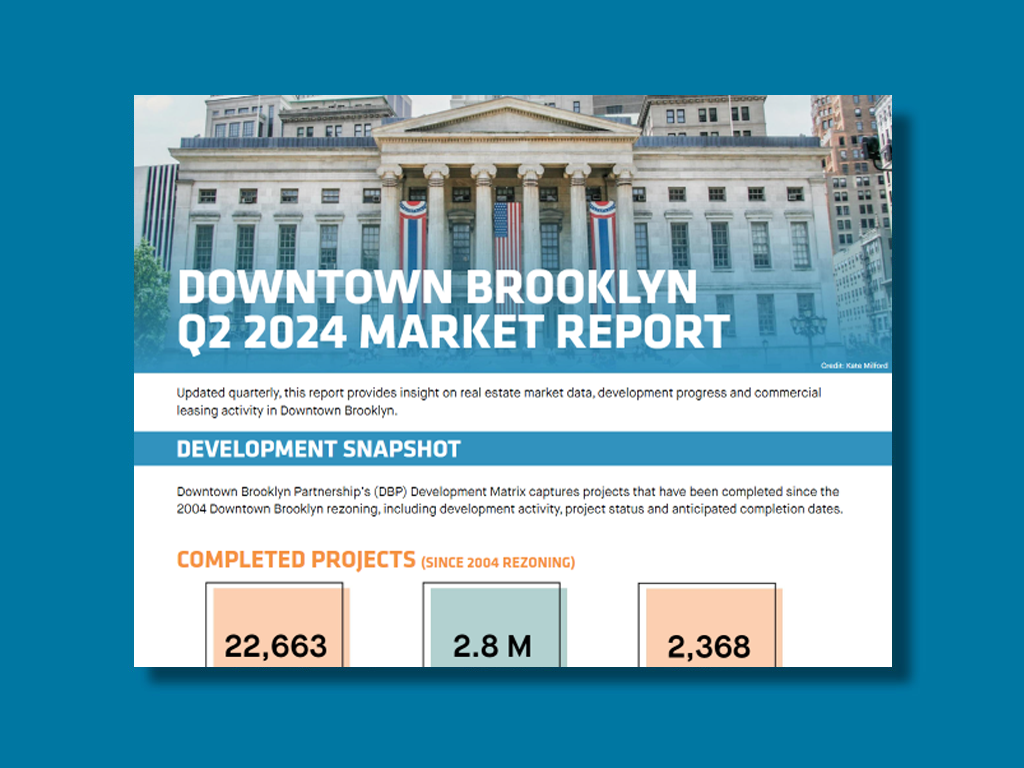
Downtown Brooklyn Q2 2024 Market Report
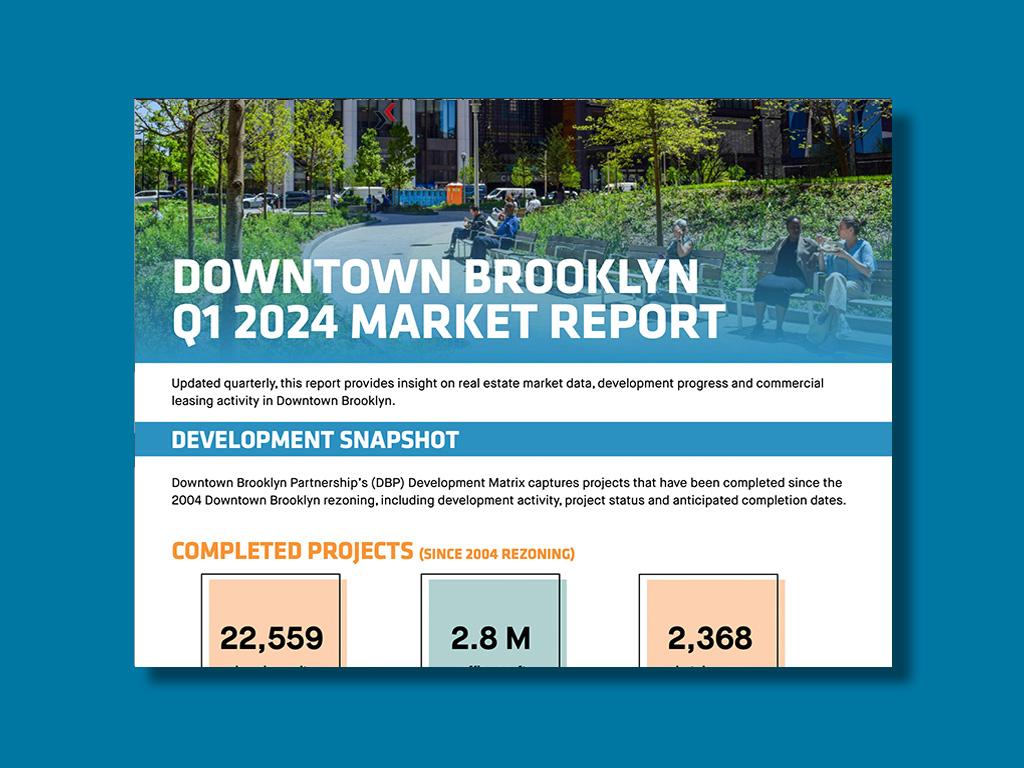
Downtown Brooklyn Q1 2024 Market Report
Downtown Brooklyn Quick Facts 2023